
Three schedule positions. One consistent view.
Import current live, previous period and project baseline XER files. Use the comparison Gantt, heatmap, Delivery Lens, Progress Pulse, delivery trajectory, period output and Milestone Orbit together.
XERR software
Turn live schedules, previous periods and approved baselines into a clear delivery picture. Follow late work, finish movements and negative total float, then open the underlying activity evidence.

Follow baseline commitments, forecast finishes and actual completions.
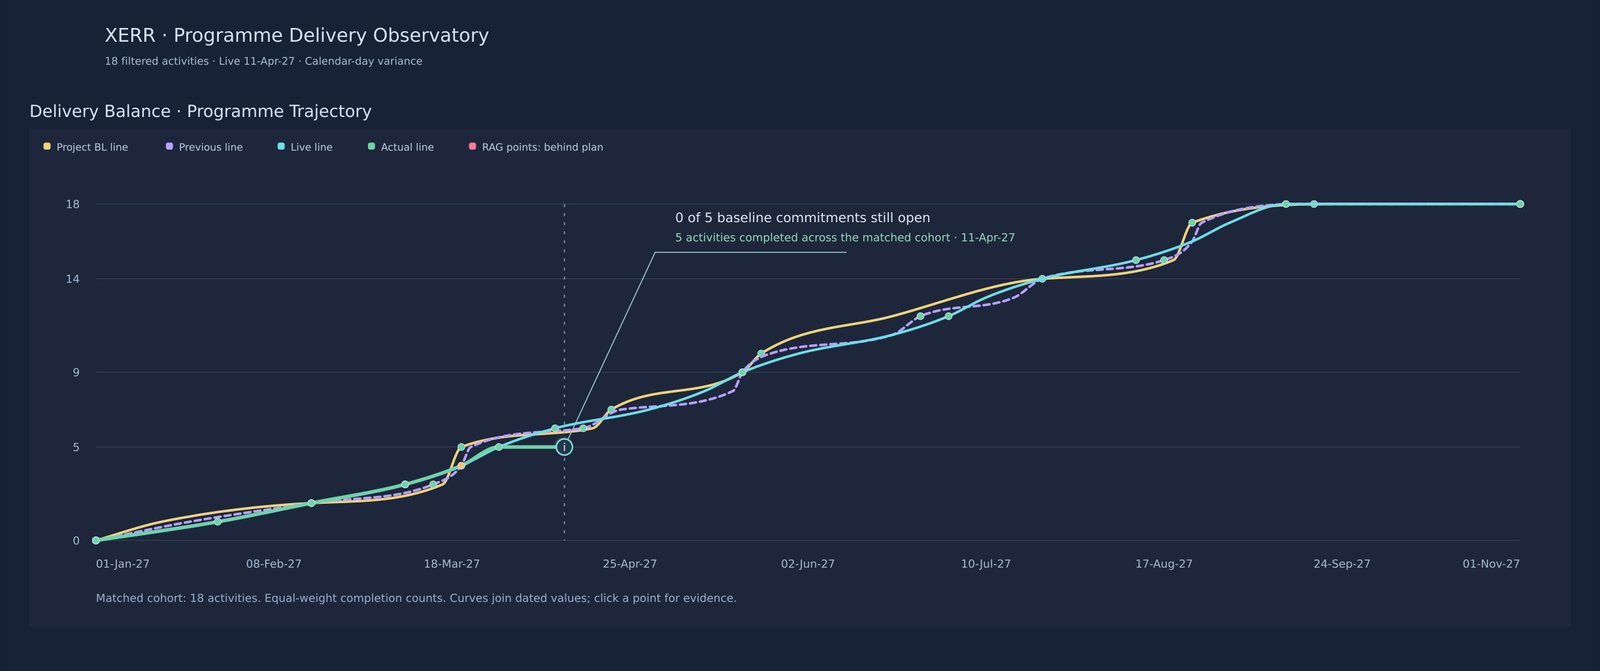
Import current live, previous period and project baseline XER files. Use the comparison Gantt, heatmap, Delivery Lens, Progress Pulse, delivery trajectory, period output and Milestone Orbit together.
Expand categories, filter and sort within columns, show or hide comparison bars, and drill into period output without changing the chart orientation. Positive finish improvement is green; negative movement is red.
The Control Hub workspace starts empty. Schedule files are processed in the open browser tab. Save a session explicitly to your own device, or export individual charts and the full set as JPEG or PDF. Access and project release remain under the owner’s control.