
XERR CHARTLINE
See where the work meets the dates.
Plot activities, milestones and baseline movement in one Time Location Chart. Follow work along a route, inspect the activity behind each line and test changes in your own workspace.
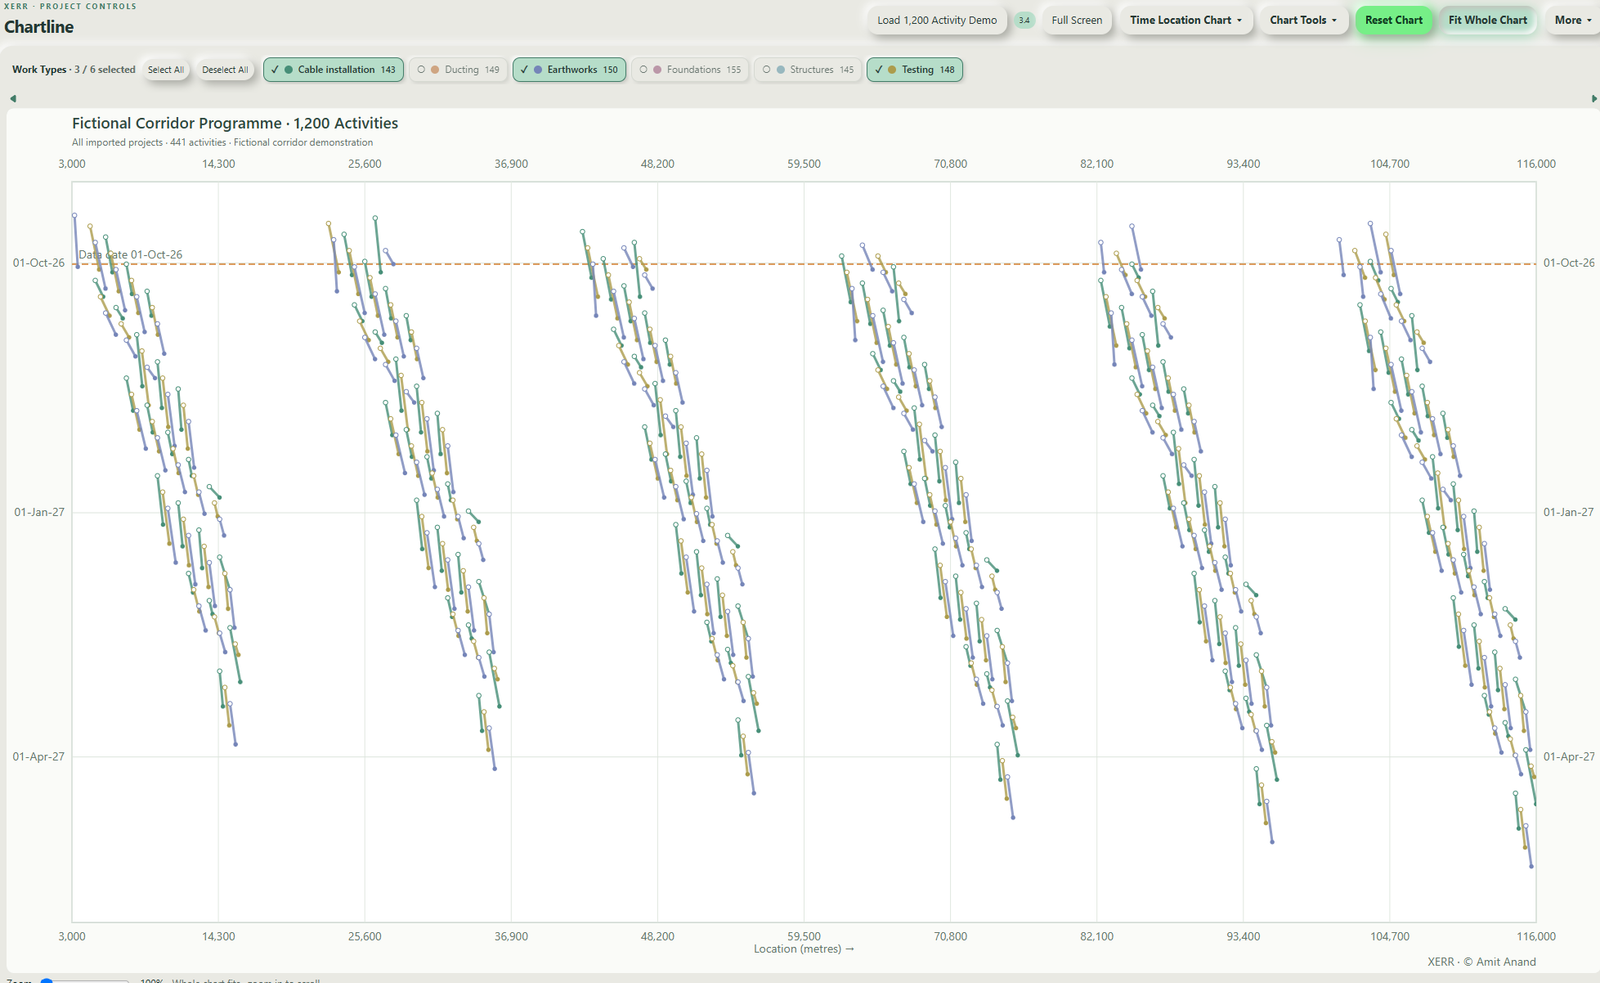
Explore a fictional corridor programme.
The public demonstration includes 1,200 activities across six corridors. Filter by project, status and work type, zoom into the chart and inspect activity dates and locations. Sample values are illustrative and are not a client programme.
Use the full Chartline workspace.
Your protected owner workspace retains XER upload, reference baselines, manual activities, scenarios, annotations, chart design and exports. Load the demonstration when needed or start with your own schedule.
Request a Chartline Demonstration