Health
Open package status, baseline variance, monthly movement and float pressure through clickable charts.
XERR GridPulse
Read asset delivery health across substations, overhead lines and underground cables. Compare the live schedule with the project baseline and previous period, then trace the position into its activities.

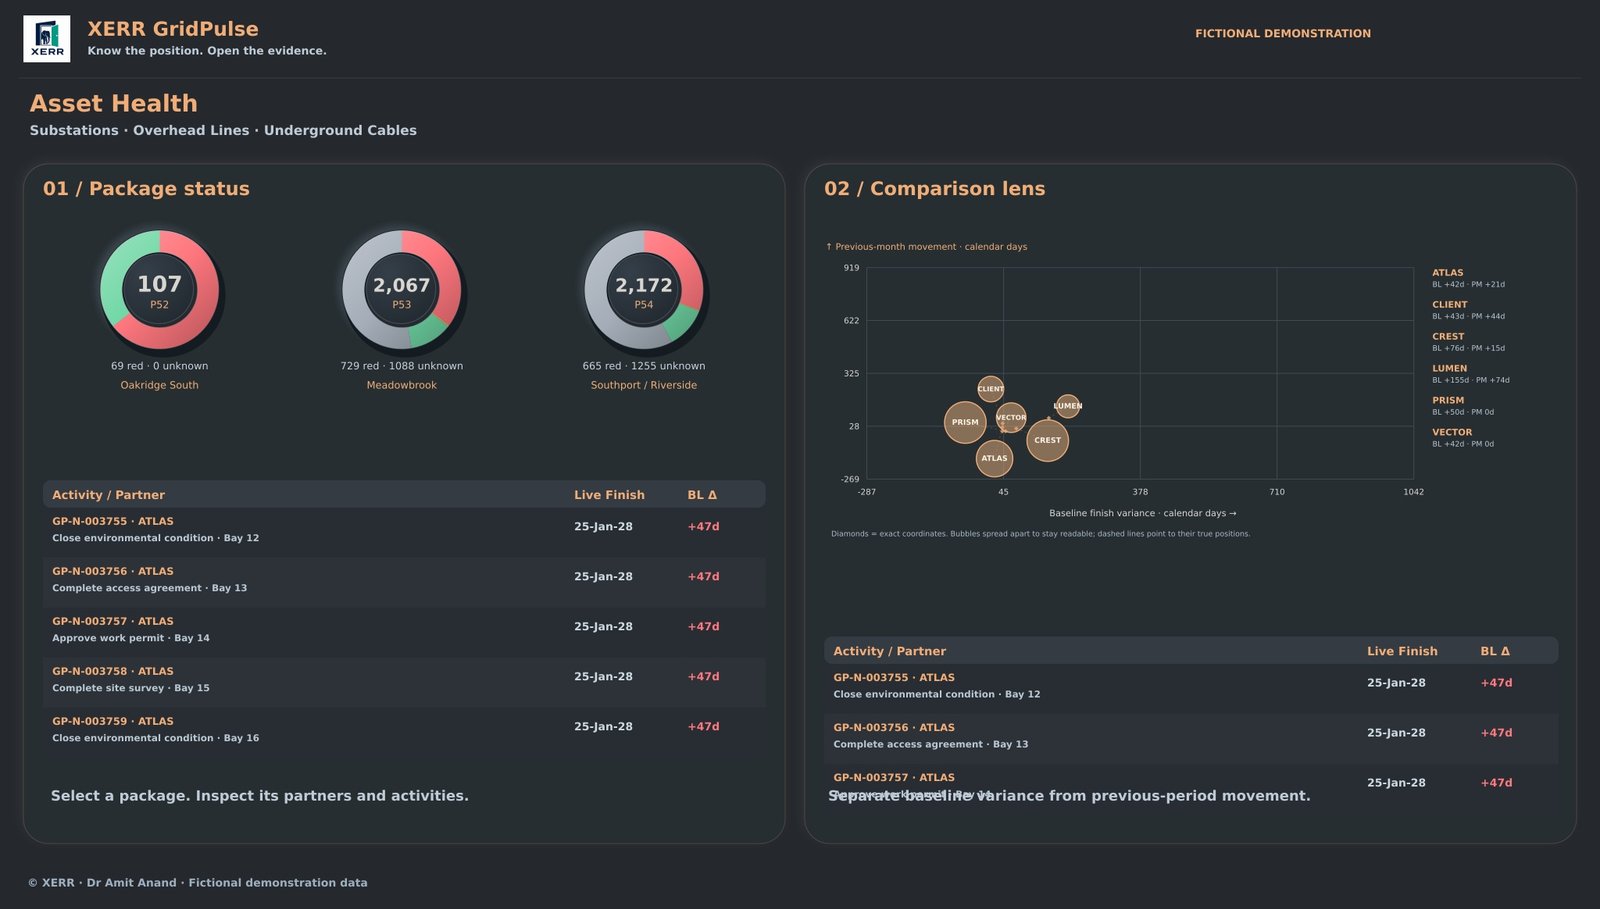
Explore package status dials and baseline versus previous-period movement, then open the activity evidence.
Seven connected views
Use package dials, comparison bubbles and float pressure for different questions. Each view keeps its activity evidence close.
Open package status, baseline variance, monthly movement and float pressure through clickable charts.
Expand categories and subcategories to see live finish dates and RAG status.
Inspect the hierarchy, expand the detail and identify the activities behind a work package.
Drill from eight weekly finish windows through partner and stage to every activity bar.
Keep programme summaries separate from asset health. Expand packages and inspect dates in place.
Reconcile current and previous populations with uploaded category profiles and backup counts.
Choose each authoritative live, baseline and previous project. Keep programmes separate and clear the session when changing projects.
The public demo uses fictional names and reconstructed activity records across two programmes. Licensed project workspaces open blank. Uploaded XER files stay in the open browser session. Chart and table JPEG exports are available; no installation is required.
£120/year
One named user. GridPulse views, XER comparison, category profiles and high quality chart exports.
Request Individual Licence£290/year
Up to five named users. Project access controlled through Control Hub and onboarding support.
Request Group LicenceCustom
Six or more users, tailored category structures, project reporting and agreed onboarding scope.
Discuss Your RequirementsXERR GridPulse